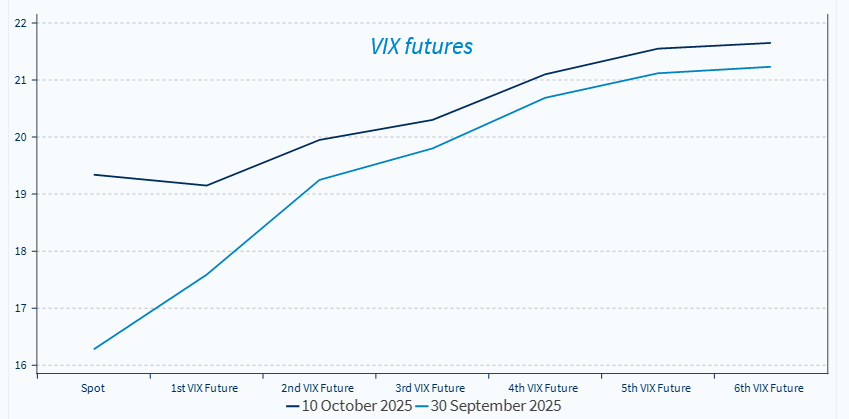

Markets took a hammering last Friday as Trump reignited trade wars with China after the Chinese authorities announced export controls on rare earths earlier in the week. On Friday, short-dated VIX futures spiked, the S&P 500 was down 2.7%, the Nasdaq 100 was down 3.6%, an MSCI China ETF quoting on US trading hours was down 6% (MSCI Japan hedged USD -4.6%), and Brent was down 3.8%. Concurrently, safe assets did well. Gold was up 1% and Treasury yields went down at both the short end and the long end of the curve.
- However, over the weekend, Trump played down the revival of trade tensions, and markets are rebounding today. S&P 500 futures are up by 1.5%, +2% for the Nasdaq 100 futures as we go to press. Echoing the volatility seen in April, we recommend that investors steer clear of trading based on Trump’s trade-related announcements, which are generally negotiating tactics and prone to flip-flops. Ahead of the APEC meeting in Korea late October/ early November, the stakes are high for both Trump and Xi Jinping, who were expected to hold a summit to discuss matters of common interest (Chinese exports of Fentanyl and rare earths, China’s purchases of US goods and access to technology, trade ). We expect the summit to take place.
- Recent developments support the balanced approach we adopted since August. Markets have performed very well in recent months and are vulnerable to some profit-taking as valuations are rich and US economic growth could be decelerating. Yet, we have refrained from turning too cautious, as some indicators suggest the labour market weakness might be temporary. On top of that, the Tech frenzy remains unabated, with massive M&A volumes in the US Tech sector, and the earnings season that is just starting is expected to see strong earnings growth in Q3 for the S&P 500 (+8% expected by the consensus). Factoring in the usual positive surprises, given that most S&P 500 companies report actual earnings above estimates, the S&P 500 will likely report earnings growth above 13% for the third quarter based on Factset’s average improvement in the earnings growth rate during the earnings season. If that happens, this would mark the 4th straight quarter of double-digit growth.
European growth remains subdued, and while the ECB does not have a growth mandate, this poses downside risks to inflation. We show in the report that industrial activity remains under pressure, in particular in Germany (-4% yoy in August), household consumption remains desperately weak and may stay weak considering adverse developments in labour markets in the largest economies (France and Germany).
- Inflation is at target and shows no signs of deceleration, explaining ECB’s limited appetite for additional rate cuts.
- However, we believe that weak growth will pose downside risks to inflation, and we expect the ECB to resume rate cuts in early 2026. We expect two rate cuts from the ECB in 2026, which would bring the deposit rate to 1.5%.
Which sectors in equities would be most exposed to a softer Eurozone macro-outlook? A softer macro pulse in Europe could revive demand for defensives and low-beta exposures in the region, in a context where economic surprises are heading south in the euro area since the end of September. Banks, that have performed very well, are vulnerable to a deteriorating eurozone outlook and easing bond yields. Travel & Leisure and Retail (OW) are also exposed, but the downside looks more limited thanks to cheaper valuations.
- We reiterate our preference for Pharma versus banks in this context; This is a contrarian (and valuation) call considering the recent performance of banks vs pharma in Europe.
Is there a ceiling for gold? After an amazing rally in recent years, gold could be seen as vulnerable. However, we show in the report that the sources of demand for gold have evolved in recent years. Jewellery took the lead after Covid, then central banks, and the PBOC in particular, were particularly important buyers post Ukraine invasion and the freezing of an estimated $ 300bn of assets from the Central Bank of Russia. In the past twelve months, ETFs picked up the baton for gold demand. We show that inflows into ETFs tracking gold have been exponential lately.
- While gold is technically overbought according to our chartist, its peculiarities and properties suggest it remains an attractive asset for the long term.
- Gold is a diversification asset that delivers strong performance as well, which is remarkable. Gold has delivered the same performance as equities in the past five years, with low correlation to equities. The correlation of daily returns in the past twelve months currently stands at zero.
- In a context where fiscal discipline is lacking, we believe that the scarcity of reserve assets not tied to leveraged public sector balance sheets is also a long-term support for gold.
- These factors suggest that having gold in a portfolio continues to make sense, but the sizing of the position matters. We advocate for a contained exposure to the asset class at current levels.
Week ahead: With the government shutdown in the US, the release of the retail sales, CPI, and PPI reports is not certain. The agenda in Europe will be light. The earnings season will see the largest US financial groups release their quarterly earnings, along with some healthcare corporations.
Markets took a hammering on Friday as Trump reignited trade wars with China. But he softened the tone over the weekend. We keep advocating for a balanced risk profile