A factor-based strategy enables investors to identify future Amazon.coms and other Nvidias at their earliest signs of outperformance.
The ambition of every investor seeking above-average gains is to develop tools to detect the next Amazon.com or Nvidia, whose performances1 since their first listings in 1997 and 1999 have reached +213,500% and +228,000%, corresponding to respective average annual returns of +32.8% and +35.8%.
To achieve this, financial research on predictive factors of outperformance has evolved significantly in recent years, following the iconic 'momentum' factor documented by N. Jegadeesh and S. Titman in 1993 in their publication "Returns to Buying Winners and Selling Losers: Implications for Stock Market Efficiency".
In this landmark study, these academic researchers demonstrate that a strategy of repeatedly selecting, twice a year, stocks with the best returns over the previous six months and holding them for six consecutive months generates an annual excess return over the market of +12.01% between 1965 and 1989.
Since then, other predictive factors of outperformance have been documented and considered statistically significant in academic circles and in the quantitative research departments of financial institutions.
Among these, the most well-known is arguably the value factor, thanks to which Warren Buffett, at the helm of Berkshire Hathaway, has produced an average performance of +18.9% per year since 1980, totaling +207,831%, compared to +9.6% per year for the S&P 500, totaling +4,912%.
The predictive factor of W. Buffett at work
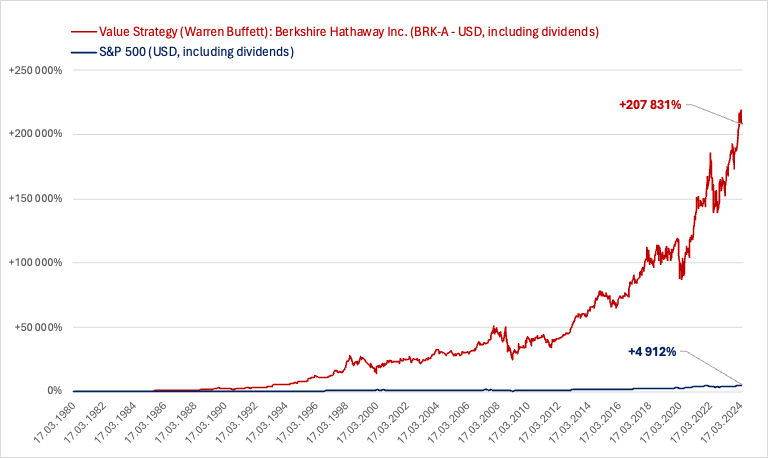
Source: FactSet and Starvest Capital
Other known predictive factors of outperformance include company size, profitability, and the degree of reinvestment of operating cash flows into the company - the latter two falling under the category of quality factors.
And as demonstrated in 2023 by Dr. David Blitz et al., head of quantitative research at Robeco, in his research titled "Factor Zoo," there are around fifteen statistically significant predictive factors of outperformance.
The investor seeking above-average gains, potentially surpassing those of Warren Buffett and comparable to those of Amazon or Nvidia, thus faces the major challenge of selecting the best factor-based approach to construct their portfolio. This raises the question: rather than exploiting a single predictive factor of outperformance, would it be relevant to combine several to increase the expected return of a portfolio?
To this question, there is a concrete answer. Indeed, after conducting a series of rigorous tests over several years, we have discovered at Starvest Capital that a synergy between four key factors of outperformance generates the best results:
- Momentum;
- Company size;
- A quality factor; and
- A proprietary hybrid factor2.
Four key factors for a winning formula
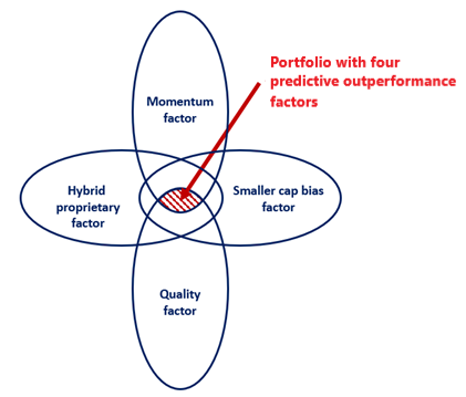
Source: Starvest Capital
Applying this methodology to the 2,840 stocks in the MSCI AC World index over the past 15 years and reconstructing an equally weighted portfolio each quarter with the 30 stocks most exposed to these four predictive factors of outperformance, we obtain an average annual return of +28.2%, compared to +10.3% for the MSCI AC World, +14.3% for the S&P 500, and +19.4% for the Nasdaq 100. Over the entire period, our factor-based strategy generates a profit of +4,053%, more than three times that of the most performing index over the period, the Nasdaq 100.
The 4-factor strategy yields +28.2% per year
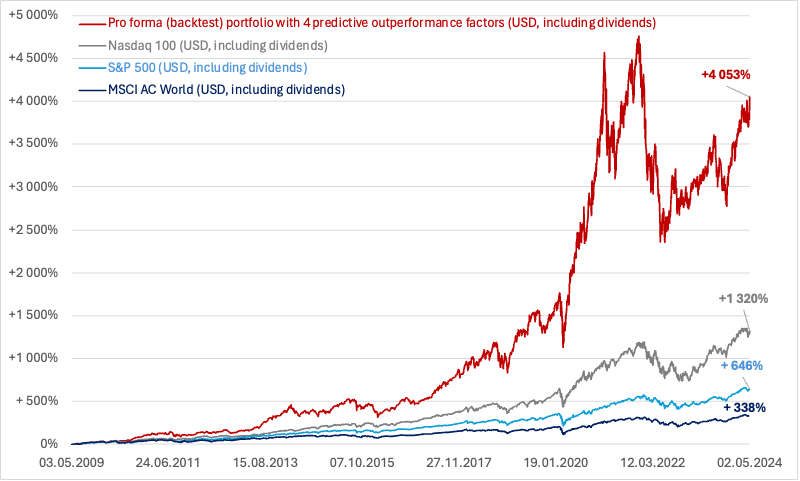
Source: FactSet and Starvest Capital, pro-forma (backtest) performance
Considering this result, it seems legitimate to wonder if the strategy would indeed have captured Amazon.com and/or Nvidia before these companies gained recognition on Wall Street. The answer is affirmative, with Amazon appearing in the portfolio during its first formation in May 2009 and Nvidia during its 33rd formation in May 2017, i.e., from the moment its stock price began its first phase of exponential growth, as the following graph illustrates.
An approach incorporating Nvidia before its takeoff
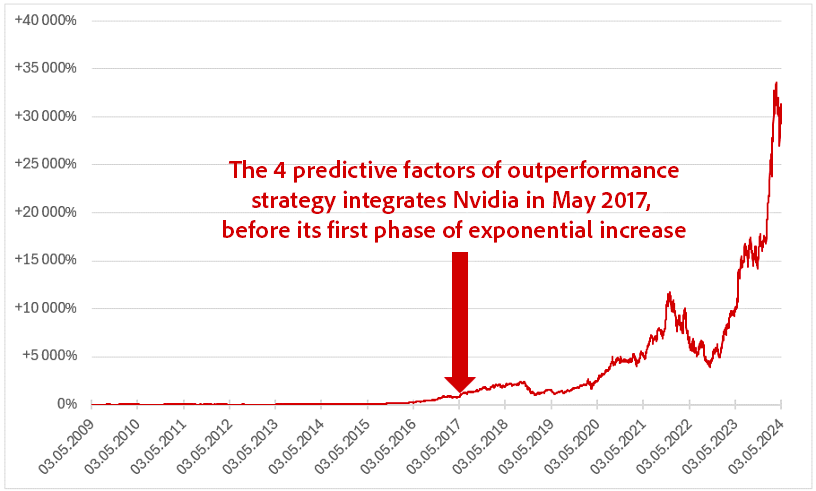
Source: FactSet and Starvest Capital
Today, as the portfolio of 30 stocks constructed in the manner described above mostly contains companies unknown to the general public, it may well contain the Amazons and Nvidias of tomorrow. Often founded by great visionaries, like Jeff Bezos or Jensen Huang at the time, these future Wall Street stars market some of the most innovative services and products.
Article by Wilhelm Sissener, CFA
Managing Partner, Starvest Capital
For more information: www.starvestcapital.com
Notes
(1) Based on their closing prices on February 5, 2024.
(2) This factor has been identified as statistically significant in seminal studies, which have examined various variations of the denominator of the ratio it encompasses. It is derived from elements of the income statement and balance sheet of the companies under consideration. After tests conducted over several years, we have selected the most compelling form.