
Investment universe
A thematic universe with alpha potential
The Structural themes reshaping the global economy.
October 2026
Universe
The Conviction Universe
as of 15 October 2026
Europe’s transition towards enhanced strategic autonomy and industrial relocation, supported by German fiscal stimulus measures and established European mid-cap champions.
European SovereigntySMIDsGerman StimulusEuropean ConsolidationThe electrification chain: nuclear revival, regulated networks and grid infrastructure, addressing rising electricity demand from AI and data centres.
UtilitiesElectric InfraDefensive positioning in demographics-benefiting healthcare sectors now at attractive valuations following 2025 headwinds.
HealthcareConcordia TechQuality sector where post-Covid headwinds are cyclical rather than structural. Recent pricing stability and strengthening consumer demand signal a recovery phase in the sector.
LuxuryAlpha
Europe’s transition towards enhanced strategic autonomy and industrial relocation, supported by German fiscal stimulus measures and established European mid-cap champions.
Defensive positioning in demographics-benefiting healthcare sectors now at attractive valuations following 2025 headwinds.
The electrification chain: nuclear revival, regulated networks and grid infrastructure, addressing rising electricity demand from AI and data centres.
Quality sector where post-Covid headwinds are cyclical rather than structural. Recent pricing stability and strengthening consumer demand signal a recovery phase in the sector.
spheres sized by portfolio weight · hover to trace a theme · click to explore a thematic
Performans ve dağılım
Profesyonel yatırımcılara özel
Kayıtlı profesyonel ve kurumsal yatırımcılar analizin tamamına erişir: her alt temanın ağırlığı, stratejinin başlangıcından bu yana alt temalarıyla birlikte performansı, aylık getiriler ve risk ölçütleri.
European Sovereignty
The Draghi roadmap centres on five key sectors at the heart of Europe’s autonomy agenda.
Europe has a plan. Three structural priorities are now in motion: closing the innovation gap, decarbonizing the economy and reducing strategic dependencies. For each pillar, dedicated plans and acts are moving from diagnosis to execution.
SMIDs

European SMIDs trade at a relative forward P/E near multi-decade lows versus large caps, weighed down by massive flows into mega-caps. Quality companies thus trade at a discount to intrinsic value.
On average, SMIDs tend to carry a higher share of domestic revenue than large caps, though the segment is far from uniform and includes a number of highly international names. Domestically focused SMIDs are better positioned to benefit from European stimulus.
Across cycles, small and mid caps have historically outperformed large caps over the long run, with the widest spreads recorded in the recovery phase that follows downturns. Earnings tend to inflect earliest in the segment as rate cycles turn. The current set-up is consistent with prior inflection points that preceded extended periods of relative outperformance.
Utilities
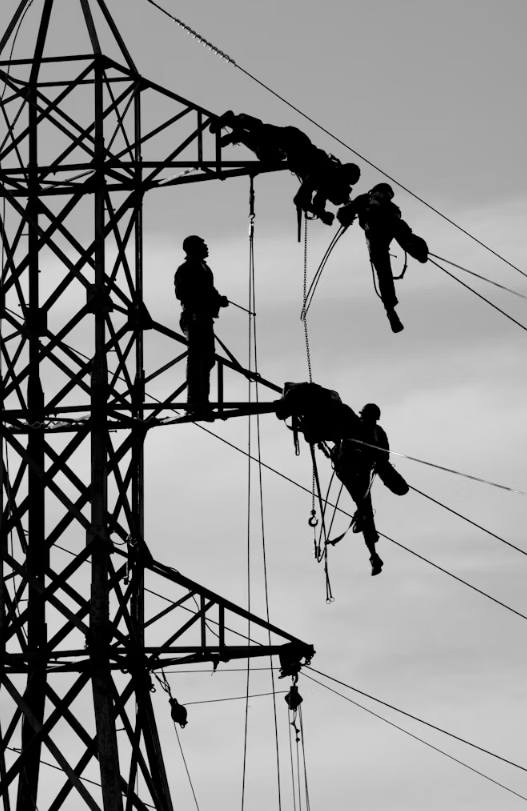
European climate commitments are accelerating clean-energy and grid investment, supporting regulated asset base growth.
AI, cloud computing and data centers are driving a structural rise in electricity demand, placing energy companies and grid operators at the core of this transformation — the essential infrastructure of Europe’s digital revolution.
Electric Infra
Electricity demand is growing faster than GDP, which itself grows faster than overall energy demand. EM economic development, the massification of EVs across the developed world and China, and the renewal of an ageing grid in advanced economies should keep this gap open for years.
The AI revolution is strong in the US and consumes a lot of energy. Forecasts for data-centre electricity demand vary across sources, but converge on a marked increase through 2030.
The Commission is moving to cut dependency on fossil fuels and accelerate electrification: an escape clause shielding electrification capex from deficit calculations, a draft cutting taxes on renewables, and a mechanism to securitise ETS to fund the transition.
German Stimulus
Three levers carry the stimulus: defence spending beyond 1% of GDP, financed off-budget with no set ceiling; a 12-year, €500bn special fund for transport, energy and digital; and tax relief plus a €15/hour minimum wage. In total, Germany plans to borrow €850bn over 2025–29.
The approved federal budget confirms record investment: €115.7bn in 2025 and €123.6bn in 2026 — up 55% versus 2024 — sustained near €120bn a year through 2029. Defence rises from €95bn (2.4% of GDP) to circa €162bn (3.5%) by 2029, with over €100bn earmarked for rail.
European Consolidation
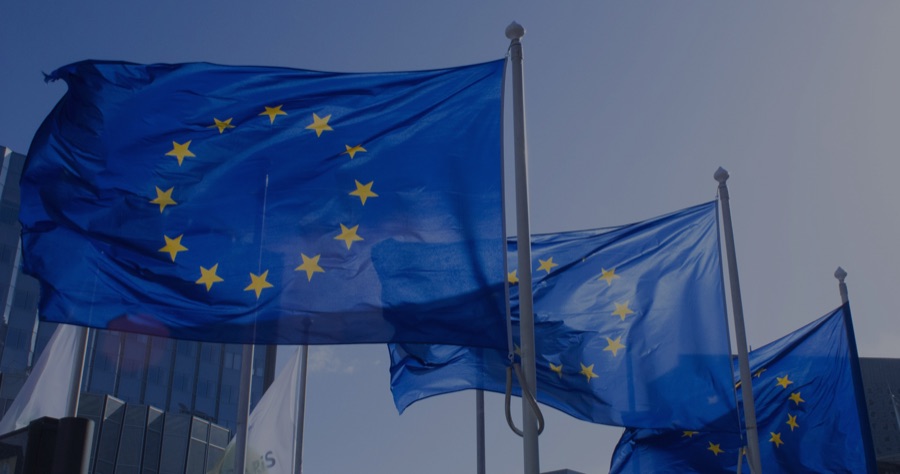
The Draghi report and the Competitiveness Compass set a clear priority: build companies large enough to fund the R&D and capital expenditure that technology-intensive industries now require. Six strategic sectors are directly concerned: aerospace and defence, energy and grids, telecoms, banks, semiconductors and critical materials. In each, fragmentation undermines European competitiveness.
Geopolitical tensions have again exposed Europe’s dependence on external energy, supply chains and defence capabilities. Strategic autonomy requires faster electrification, secure infrastructure and a defence strategy that does not rely solely on the US. AI is raising the minimum scale needed to compete, and China’s state-supported industrial capacity puts growing pressure on European companies.
Merger review is shifting from a narrow focus on short-term competitive harm to a broader assessment of scale, investment, innovation and resilience. There is no blanket exemption for European champions, but companies now have a stronger basis to show that consolidation delivers strategic benefits, provided they are credible, merger-specific and sufficient to offset competitive harm.
Healthcare

Healthcare is among the sectors least correlated with the AI trade, bringing genuine diversification versus Technology at a time when geopolitical disruption and higher commodity prices penalise cyclicals. European pharma also retains significant catch-up potential versus US peers, with sector valuations recently slipping below their historical average.
Not new, but powerful: the median age keeps rising in Europe and in the US, and health intensity rises steeply with age. Combined with the growing prevalence of obesity and chronic disease, this underpins a structural increase in health spending and supports earnings growth across the sector regardless of the cycle.
The innovation race produces both winners and losers: some former leaders have de-rated sharply, while Medtech was hit hardest by cost inflation, tariffs and China headwinds, leaving valuations not far off all-time lows. With a large share of revenues generated in the US, trade policy remains a key risk, which argues for a diversified rather than concentrated exposure.
Luxury

The luxury market is evolving rapidly, with experiences significantly outperforming tangible goods in recent consumer surveys. This trend reflects a structural and cultural shift from ownership toward lived experiences. Within experiential luxury, most segments remain resilient, including hospitality, private aviation, yachting, and cruises.
US luxury spending is rising across apparel, hard luxury and beauty: American luxury brands grew about 10 to 15% year-on-year in Q1, at constant exchange rates. Shoppers under 35 are increasing their luxury spending about 4 points faster than older generations, and upper-middle-income households twice as fast as the wealthiest. The customer base is broadening.
Quarterly growth turned positive in Q4 2025 after two years of decline. Online luxury sales rose 25 to 35% year-on-year in Q1 2026, and ready-to-wear is growing twice as fast as leather goods. Chinese consumers are moving away from status purchases toward products that express belonging and individuality: a new luxury mindset rather than a return to old patterns.
Concordia Tech
Stratejiler hakkında Renalco ile görüşün
Bu stratejinin portföyünüze nasıl uyabileceğini ekibimizle konuşun.
Bize ulaşın
Important legal information & full disclaimer
This document is produced by Kepler Cheuvreux, an investment firm authorized by the ACPR under number 14441 and regulated by the Autorité des Marchés Financiers, incorporated in France under number RCS 413 064 841 at the following address: 112 Avenue Kleber, 75116 Paris, France (www.keplercheuvreux.com). The information has not been prepared by the issuer or any of its subsidiaries. The issuer and its subsidiaries disclaim any responsibility for the content of this document.
This document does not constitute a prospectus/regulatory document or other offering document, nor does it constitute an offer or solicitation to purchase securities or other investments. It should not be construed as an offer to sell or a proposal to buy any securities in any jurisdiction in which such an offer or proposal would be unlawful. We are not soliciting any action on the basis of this document, which is provided to our clients for general information purposes. It does not constitute an investment recommendation or a personalized recommendation, and does not take into account the investment objectives, financial situation and needs of each client. Before acting on the contents of this document, we advise you to check whether it is suitable for your particular situation and, if necessary, to seek professional advice.
This document is confidential and may not be communicated to a third party (with the exception of external advisors and under the condition that they respect this confidentiality themselves) nor reproduced in its totality nor partially without prior written consent from Kepler Cheuvreux.
This document may contain “Research” as defined by the MiFID II Separation Rules. If the document contains “Research”, it is only intended for firms that either fall within the scope of the MiFID II Research rules and have subscribed to one of the Kepler Cheuvreux offerings, or are not subject to these MiFID II rules and therefore are not required to pay for Research under MiFID II. If your firm is subject to MiFID II separation rules regarding “Research”, it is your firm’s responsibility to ensure that you only view or use the “Research” content in this document if your firm has subscribed to a Kepler offering. All regulatory information relating to the application of MAR and research warnings are available at https://www.keplercheuvreux.com/en/research-important-disclaimer/. “Kepler Cheuvreux” refers to all subsidiaries, branches and affiliates of Kepler Cheuvreux SA.